You have more data available now than any point in history.
The World Economic Forum expected the world to hit 44 zettabytes by 2020 – 40x more bytes than stars in the sky.
If you’re like most businesses, you have more data than you know what to do with. The key to success, however, is properly accessing and utilizing that data.
Case in point: visualizations and digital signage.
Data visualizations bring clarity and action to people who don’t crunch numbers every day but need to understand the metrics – and comprehensive digital signage is the perfect way to get it where it needs to be.
5 Data Visualization Use Cases Displaying the Power of Digital Signage
Looking for fresh ways to engage your team and keep everyone informed? Consider these data visualization use cases that utilize digital signage unlike anything else.
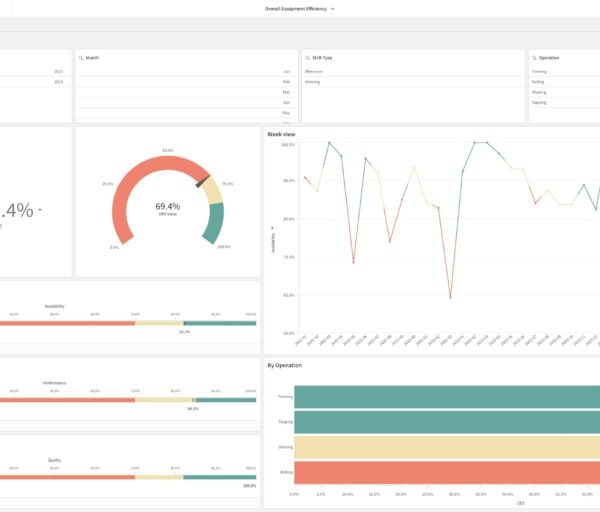
1. Production Floor Efficiency
Foremost, data visualization on digital signage can keep everyone safe on the floor by updating them on changing conditions and machinery statistics.
You can also keep everyone informed on production output by sharing visualized metrics from the last day, week, and month and layering it over data from the previous year or period.
Go further with metrics and visualizations for each line or department.
Keep everyone engaged with goals and celebrations too.
2. Production Facility Output
Production managers might like to see the same type of statistics regarding their team’s output as well as overall productivity and other employee-related metrics.
Managers and leadership can also benefit from visualizations on how their facility performed compared to other locations or similar facilities in their industry.
3. Top Management Floors
People in top leadership positions don’t have time to sort through metrics and analytics looking for something relevant.
They need digestible data as it relates to the things they care about – and they need it in accessible places.
Use data visualization on digital signage to keep management updated on high-level metrics relating to productivity, quarterly performance, share prices, investors, and market share. Integrate your digital signage with Microsoft’s BI for instant insights.
4. Logistics Centers
Logistics centers can’t function without seamless access to data. Data visualizations on digital signage make work proactive instead of reactive.
Keep everyone informed on road conditions, fares, weather, holdups at border crossings, traffic maps, population density heatmaps, destination conditions, and more.
Each employee should have access to the same data via digital signage in their trucks, COVID infections, loading docks, and receiving areas.
5. Breakrooms
Consider who uses each breakroom and what data would be useful to them. Visualizations to boost morale like goals met, goals near-met, upcoming holidays on the calendar, and what everyone’s accomplished together.
It is also a good idea to include some lighter content such as local news, weather or lunch menus into the content flow to entertain the target audience.
Take Your Data Visualization Use Cases to the Next Level with Digital Signage
Data visualization alone helps you display metrics in a way that’s easy for everyone to understand and use right away. Once you have your visualizations, however, getting them in front of the right sets of eyes is another hurdle itself. Let digital signage take the lead, seamlessly.
Valotalive loves data! Our digital signage tools integrate with tons of key apps so you can get information exactly where it needs to be instantly.